Clusterward
Logs & monitoring

Kubernetes monitoring without your own monitoring stack

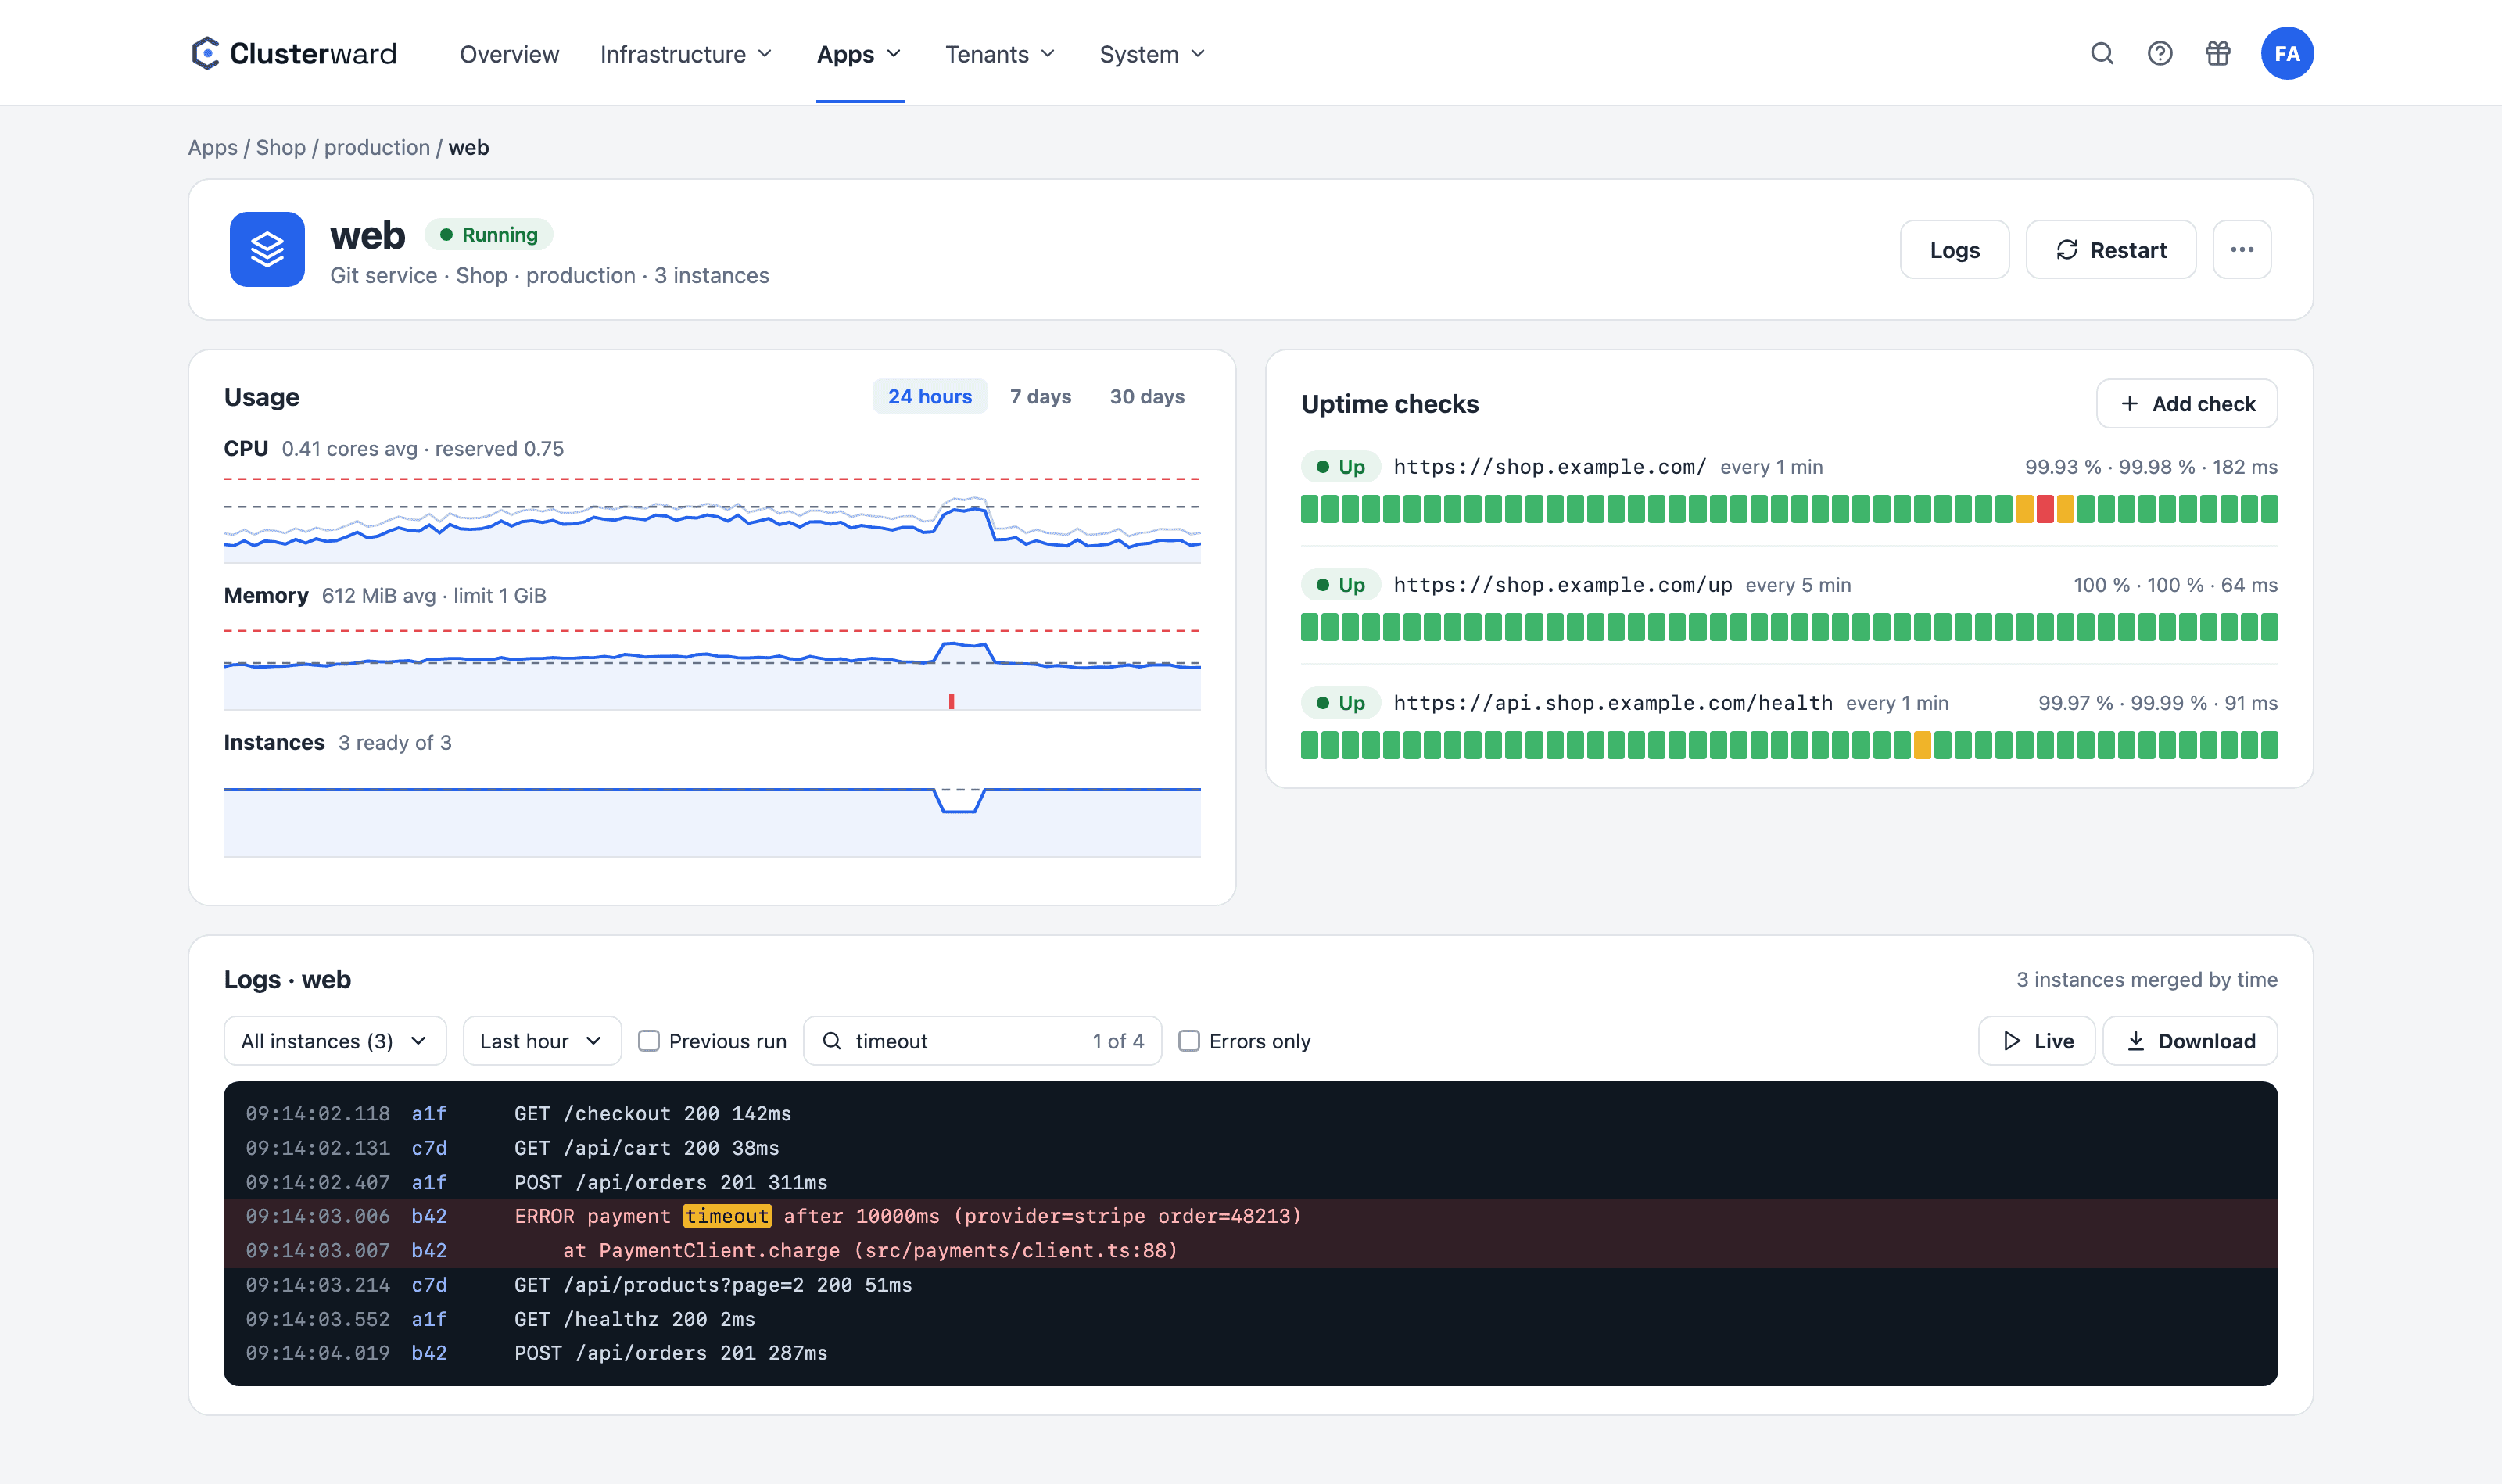
When something goes wrong, you want to see three things: what the application is writing right now, how heavily it was loaded and whether it is reachable from outside. Clusterward shows all of it on every service – logs from all instances, CPU and memory over 30 days, and uptime checks with alerts. No agent in the cluster and no Grafana setup.

Logs, usage and uptime checks for a service in the Clusterward Cockpit
Logs of all instances, usage and uptime checks of a service in the Clusterward cockpit
Illustration: a simplified view. The product shows more details and options.
In brief

What monitoring means in Clusterward

Kubernetes monitoring in Clusterward consists of three parts on the service: a log viewer that merges the output of all instances by time, a usage history for CPU, memory and instances that Clusterward records itself every minute, and uptime checks that test your domains from outside. If something fails, notifications speak up – and the link takes you straight to the logs.

At a glance

Logs
All instances together, up to 10,000 lines, live or as a download
Crash
Logs from the previous run of a crashed container
Usage
CPU, memory, instances from 15 minutes to 30 days, as a share of the limit
Uptime
Up to 10 checks per service, from every minute to every 15 minutes
Alerts
Site down and back up, via Slack, Teams, webhook, email
Setup
No agent in the cluster, nothing to install
How it works

From alert to root cause

  1. 01

    Notice

    An uptime check fails twice or a deployment fails – the message goes to your channels.

  2. 02

    Open

    One click in the activity indicator opens the logs; after a crash, straight to the previous run.

  3. 03

    Narrow down

    Search, show errors only, pick a time range, look at usage alongside.

  4. 04

    Fix

    Increase memory, restart or restore an earlier version.

What’s included

What logs & monitoring cover

What you need first during an incident, right on the service in question.

Logs from all instances

The output of all instances of a service, merged by time, with a marker showing which instance each line came from. Or a single instance on its own.

Time ranges and live

The last 500 lines, 15 minutes, one hour, 6 or 24 hours – up to 10,000 lines, smooth to scroll. Or follow along live.

Search and error filter

Matches are highlighted and you jump from one to the next. “Errors only” hides everything else.

Previous run

If a container crashed and restarted, Clusterward shows the logs of the crashed run – that is usually where the cause is.

Usage over 30 days

CPU and memory as a share of the limit, plus the instances, recorded every minute, from 15 minutes to 30 days. The request as a line, restarts as markers, and a click opens the chart large with current, average and peak values – for Helm services too.

Uptime checks

Tests a domain of the service over HTTPS, with a path and expected status. Availability over 24 hours and 7 days, plus the average response time.

Alerts on outages

Two consecutive failures report the site as down, the first success afterward as back up. Once per event, not as a flood.

Download as a file

The selected time range as a .log file, to pass on to developers or support.

Status in the header

A failed check stays in the cockpit’s activity indicator until it responds again.

Standards, not DIY

Straight from Kubernetes, without an agent

  • Kubernetes log API

    Logs come straight from the pods via the Kubernetes API – nothing is installed in the cluster.

  • metrics-server

    CPU and memory come from the cluster’s metrics-server; without it, Clusterward records the instances.

  • HTTPS check

    Checks send a GET over HTTPS, do not follow redirects and treat certificate errors as an outage.

  • Your channels

    Alerts go out through notifications: Slack, Teams, webhook or email.

What changes

Monitoring with and without Clusterward

Facts

What stays visible, and for how long

Clusterward stores usage and check results itself; it reads logs live from the cluster.

DataResolutionHow long
LogsEvery lineAs long as the pod lives (last and previous run)
Usage, 24 hoursPer minute24 hours
Usage, 7 daysPer 10 minutes7 days
Usage, 30 daysPer hour30 days
Uptime resultsEvery check7 days
NotificationsEvery message30 days in the delivery log
Further reading

How monitoring fits in

Where alerts go and which events report in is set under Notifications. How a failed rollout is detected and how you return to an earlier version is covered under Deployments.

What the overview means for technical leadership is described in For CTOs; what evidence the logs provide for an audit, in Audit & NIS2.

What kubectl can do, where it stops and when your own stack pays off is described in Logs, usage and uptime without your own monitoring stack; how to get back after a faulty release, in Rollbacks on Kubernetes: why a tag is not a version.

Related pages

What goes with it

Deployments

Git, container image or Helm chart – rolled out with a health check.

Go to Deployments

For CTOs

Predictable costs, no single point of knowledge, no lock-in.

Go to For CTOs
FAQ

Frequently asked questions about logs & monitoring

  • No. Clusterward reads logs through the Kubernetes API and usage through the cluster’s metrics-server, and the uptime checks run from Clusterward. Without metrics-server, Clusterward only records the number of instances.

Can’t find your question? Write to us – we usually reply on the same business day.

Ask a question

Logs and monitoring in the demo

We make a service crash, find the cause in the previous run and set up an uptime check with alerts in your Slack.