
At a glance
- Inputs
- Name, domain and cluster
- Database
- none – SQLite on the disk
- Disk
- 2 GiB, daily snapshots, 7 days
- Image
- Uptime Kuma 2, rootless, pinned
- Certificate
- Let’s Encrypt for your domain
- Protection
- Setup password until the first account
Uptime Kuma checks your websites, APIs and servers from the outside and shows availability and outages on status pages. From Clusterward’s app catalog it runs in your own cluster: give a name, a domain and the cluster, no database needed – a disk with snapshots, a certificate and protection until setup come with it.
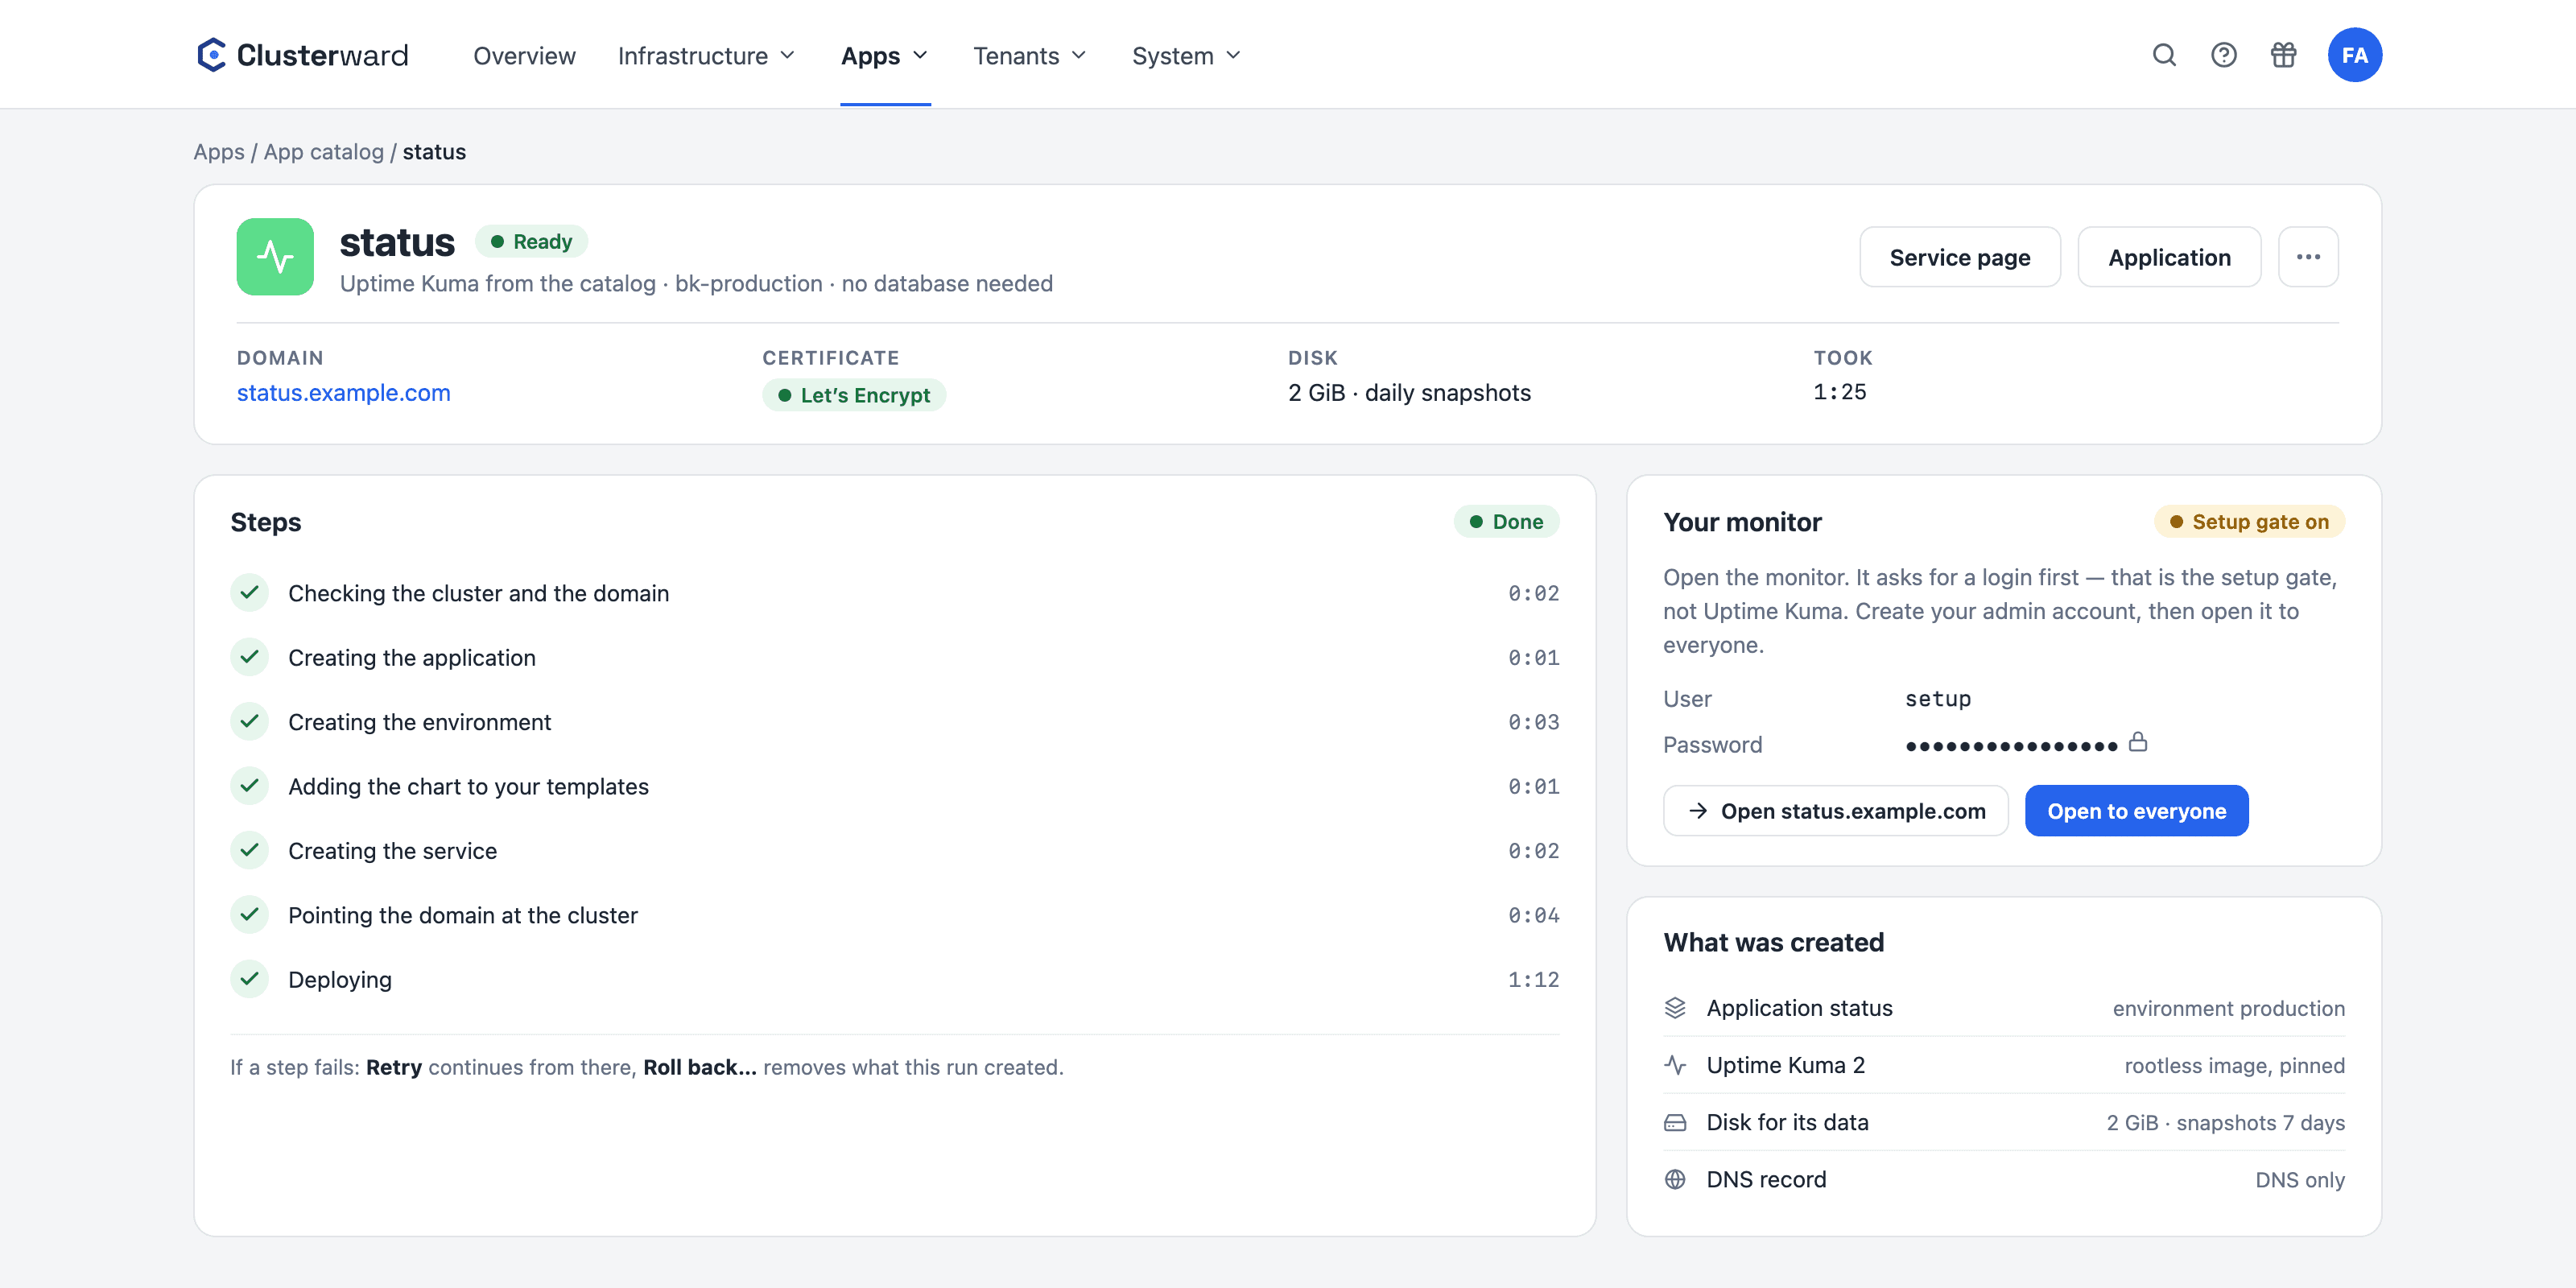
Uptime Kuma is a free status and uptime monitor. Clusterward’s app catalog brings it to your Kapsule cluster as a ready-made blueprint: an application of its own with a Helm service that runs Uptime Kuma 2 from the rootless image, keeps its data in SQLite on a disk of its own with daily snapshots and is reachable through a Let’s Encrypt certificate. After that it is an ordinary application in the cockpit.
Apps → App catalog → Uptime Kuma. Enter a name, a domain and the cluster – the cluster needs the NGINX ingress controller.
Application, environment production, chart, service with its disk, domain and – in a registered zone – the DNS record. Then the deploy.
The site first asks for the user setup and the password from the run page. Behind it you create your admin account in Uptime Kuma.
“Open to everyone” removes the protection and rolls out again. Then you set up monitors and status pages.
What you would otherwise work out yourself on the first Helm install.
Uptime Kuma shows availability and outages on public status pages – under your own domain.
The data lives in SQLite on the application’s disk. You need no database instance, and no database costs are added.
2 GiB of Scaleway Block Storage, a snapshot every day, kept for seven days. Restore and on-demand snapshots from the Volumes card.
A fresh Uptime Kuma shows its account page to whoever arrives first. The setup password keeps strangers out until your admin account exists.
Let’s Encrypt for your domain. If the zone sits at Cloudflare or Scaleway DNS and is registered, the record is created automatically.
The dashboard holds a long-lived WebSocket connection. The ingress keeps it open for up to an hour instead of cutting it after a minute.
The image runs without root and is pinned to the tested major version. An update is a new image tag on the service page.
If a step fails, “Retry” continues from there. “Roll back…” removes everything the run created, in reverse order.
Logs, usage, restart, domain and resources are managed on the usual pages. Nothing stays tied to the blueprint.
A plain chart in your templates, versioned as “Uptime Kuma (catalog)”.
The official image in its slim-rootless flavour, without the embedded MariaDB.
One volume per instance, snapshots directly at Scaleway.
Let’s Encrypt via HTTP-01 for the domain, renewed automatically.
Uptime Kuma needs less than WordPress: no database instance, just a cluster with the NGINX ingress controller and a domain.
| What | You | The catalog |
|---|---|---|
| Cluster | with the NGINX ingress controller | checks it before starting |
| Domain | a free hostname | certificate, record in registered zones |
| Database | nothing | not needed |
| Data | nothing | 2 GiB disk, daily snapshots |
| Resources | nothing | 50 m CPU and 128 MiB reserved, up to 500 m and 512 MiB |
Clusterward checks the domains of your services itself: uptime checks on a service report an outage after two failures to your channels – for your team, with nothing to install. Uptime Kuma is for what your customers should see: public status pages, monitors for services outside Clusterward and a history of its own.
Uptime Kuma is the second blueprint in the app catalog after WordPress. How its disk is backed up and restored is described under Volumes & snapshots, how the domain gets its record under DNS & certificates.
What Clusterward shows on every service without Uptime Kuma – logs, usage and uptime checks with alerts – is covered under Logs & monitoring.
Logs, 30 days of usage and uptime checks on the service.
Go to Logs & monitoringDatabase, disk with snapshots, cron and certificate in minutes.
Go to WordPressDisks per service, scheduled snapshots and restore.
Go to VolumesYour question isn’t here? Write to us – we usually reply the same working day.
Ask a questionWe create an instance from the catalog, open it behind the setup password and set up the first monitor with a status page.